Lead Generation Statistics 2026: 70+ Data Points to Shape Your B2B Strategy

Understanding the 2026 Lead Generation Landscape
Staying ahead in B2B marketing requires more than intuition—it demands real data. The latest lead generation statistics for 2026 provide a clear picture of what works, what doesn't, and where budgets are shifting. This comprehensive guide covers 70+ data points across AI adoption, in-person events, content marketing, email performance, and demand generation trends to help you refine your go-to-market strategy.
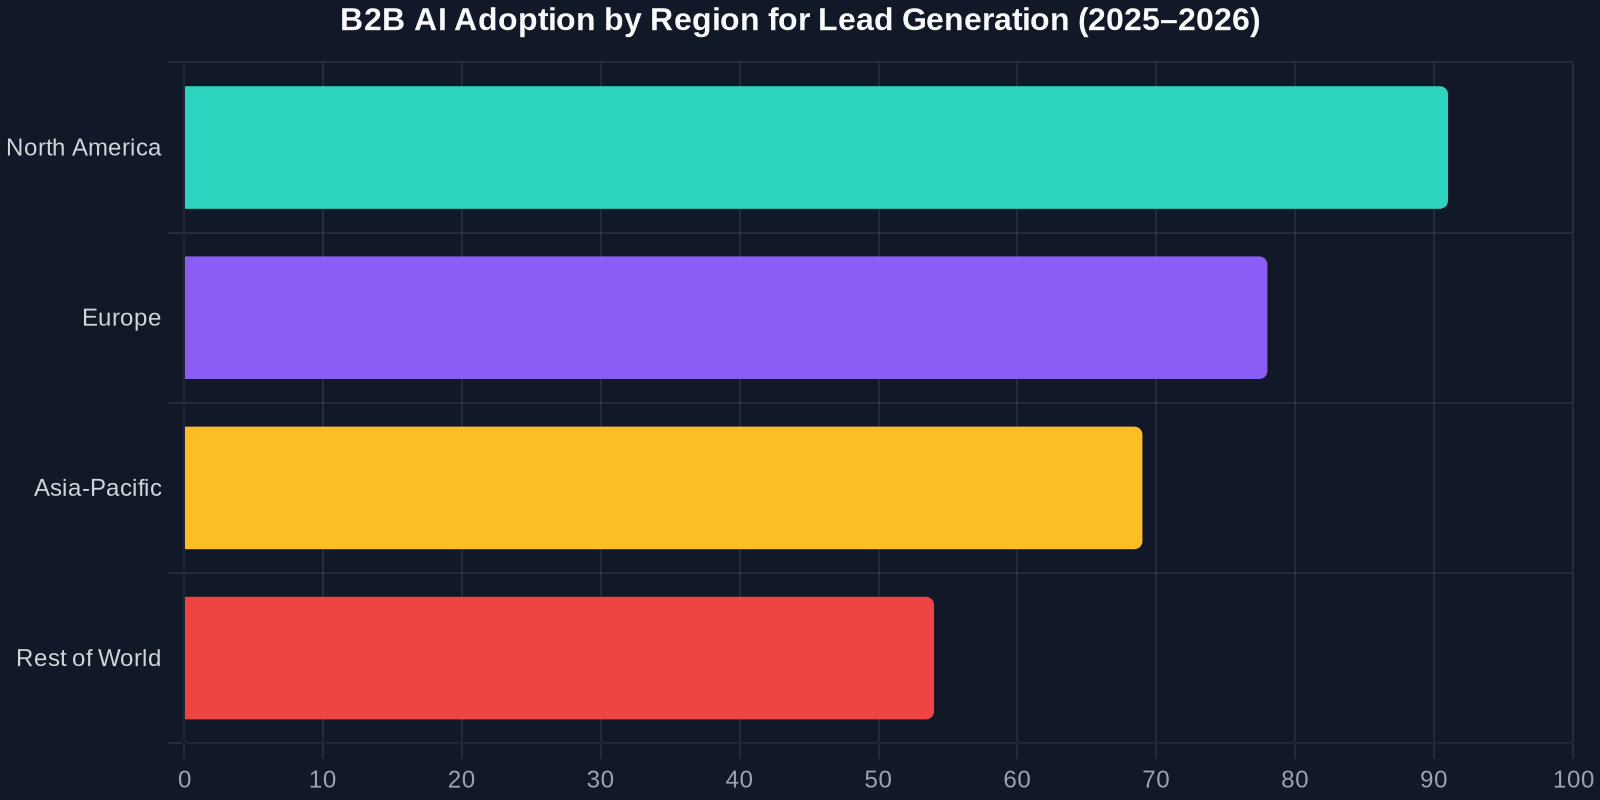
In 2025–2026, roughly 87% of marketers use AI in at least one workflow, and North American teams lead with an adoption rate near 91% (CoSchedule, 2025; Statista). AI saves marketers significant time, but the real prize is better lead quality and higher conversion rates.
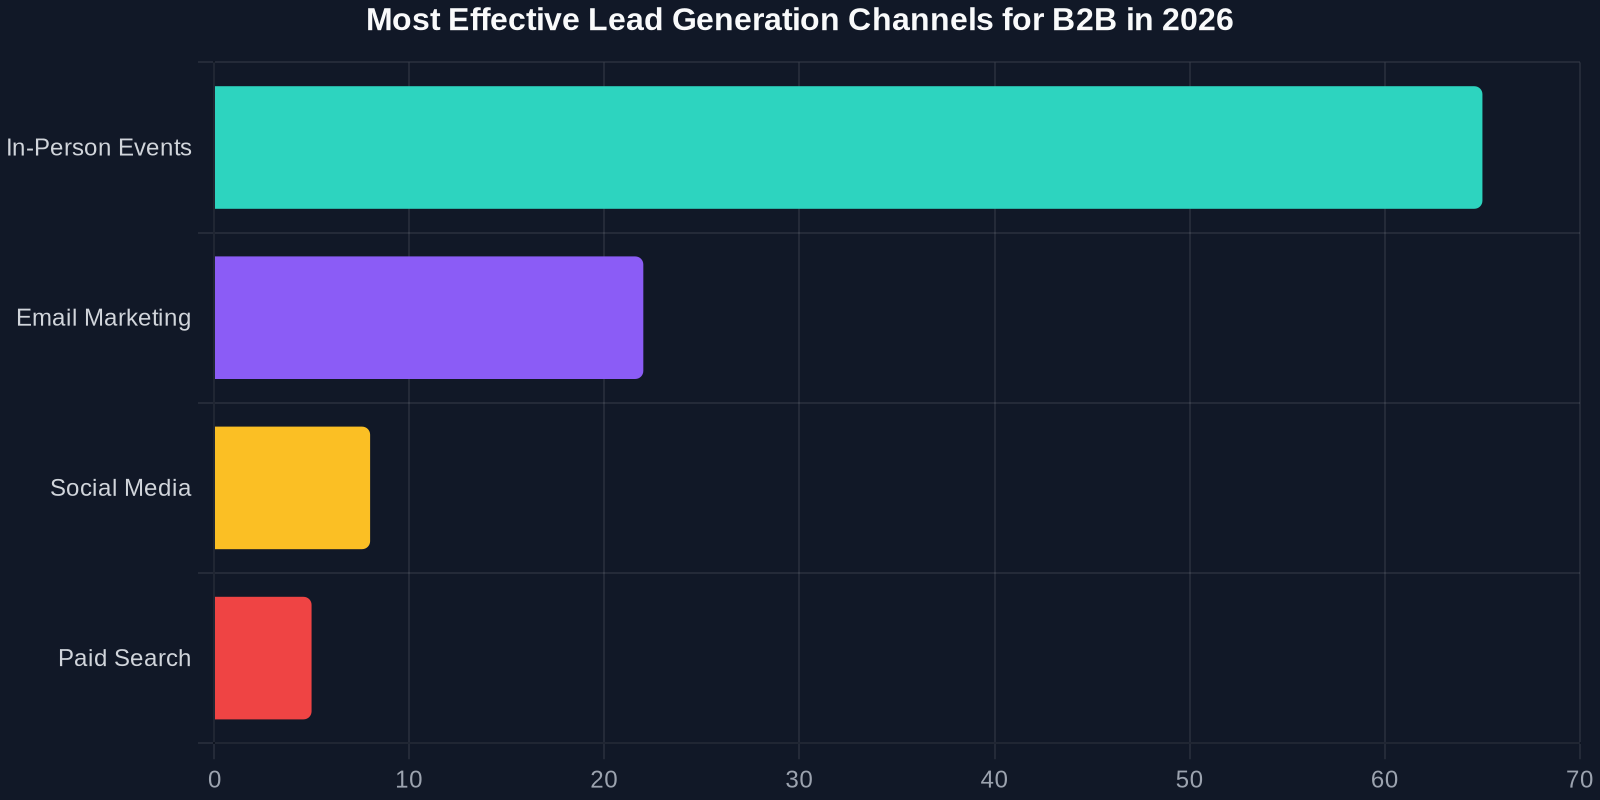
65% of companies now rate in-person events as their most effective lead generation tactic. After years of virtual-only engagement, the pendulum has swung back toward face-to-face connection, albeit with a digital hybrid twist.
Why These Stats Matter for Your Pipeline
Lead generation is the lifeblood of B2B growth. With buyer expectations rising and competition intensifying, you need benchmarks to gauge your performance against industry norms. Whether you are evaluating channel mix, AI investment, or event strategy, the 2026 data offers a roadmap.
Let's dive into the most revealing numbers.
AI Adoption Reshapes Lead Generation Workflows
Artificial intelligence has moved from experimental to essential. Nearly 9 out of 10 marketers now rely on AI for tasks ranging from content creation to predictive lead scoring.

AI Adoption by Region
| Region | AI Adoption Rate |
|---|---|
| North America | 91% |
| Europe | 78% |
| Asia-Pacific | 69% |
| Rest of World | 54% |
Event Effectiveness Compared to Other Channels
| Channel | % Who Rate as "Most Effective" |
|---|---|
| In-person events | 65% |
| Email marketing | 22% |
| Social media | 8% |
| Paid search | 5% |
B2B Marketing Budgets and Channel Allocation
Budgets are shifting toward performance-based channels and content that educates. According to 70+ B2B marketing statistics for 2026, the average B2B company allocates:

- Content marketing: 28% of total budget
- Events (in-person + virtual): 25%
- Paid digital (search, social, display): 22%
- Email marketing: 12%
- Other (PR, direct mail, etc.): 13%
Content Marketing and Lead Quality
Content remains the bedrock of B2B lead generation, but quality now trumps quantity.
Top Content Formats for Lead Generation in 2026
- Case studies – 73% of B2B buyers rank them as most influential.
- Whitepapers and reports – Preferred for in-depth research.
- Video tutorials – Engagement rates are 2.3x higher than text alone.
- Interactive content (quizzes, assessments) – Drive 2x conversions.
Email Marketing Remains a Core Channel
Despite the rise of social and AI, email continues to deliver strong ROI. For every $1 spent on email marketing, the average return is $36.

Demand Generation Trends to Watch
The line between marketing and sales continues to blur. Demand generation now encompasses everything from brand awareness to pipeline acceleration.
10 Key Demand Generation Trends for 2026
- Account-based everything – ABM expands to include customer retention and upsell.
- AI-powered predictive lead scoring – Models improve accuracy by 30% year-over-year.
- Conversational marketing – Chatbots and live chat capture leads in real time.
- Hybrid events as standard – No going back to purely in-person or virtual.
- Zero-party data collection – Interactive content (polls, assessments) yields explicit buyer preferences.
- Community-led growth – Peer communities build trust and generate referrals.
- Video-first content – Short-form video dominates social and email.
- Privacy-compliant targeting – First-party data strategies replace third-party cookies.
- Voice and audio content – Podcasts and voice search optimization gain traction.
- Sustainability messaging – 45% of B2B buyers prefer vendors with clear ESG commitments.
Comparison: Traditional vs. Modern Demand Generation
Industrial Robot Installations: A Proxy for Manufacturing Demand
In the United States, industrial robot installations rose 11% year-on-year to 38,000 units in 2025. This points to strong manufacturing investment, which correlates with increased B2B buying in automation, software, and industrial services.
Lead Generation Metrics You Should Track
Not all lead generation statistics are created equal. Focus on these actionable KPIs:
- Cost per lead (CPL) – Benchmarks vary by channel. In-person events have higher CPL but higher conversion rates.
- Lead-to-MQL conversion rate – Typically 15–30% for B2B.
- MQL-to-SQL conversion rate – Average 10–20%.
- SQL-to-opportunity – Target 30–50%.
- Opportunity-to-customer – Average 20–30%.
- Pipeline velocity – Days from lead to opportunity.
- Attributed revenue per channel – The ultimate measure of ROI.
Putting the Stats into Action: A 5-Step Framework
Step 1: Audit Your Current Channels
Map your existing lead generation efforts against the statistics above. Are you over-invested in underperforming channels? Under-invested in AI and events?
Step 2: Prioritize AI Integration
With 87% adoption among peers, AI is no longer optional. Start with low-risk use cases like email personalization and chatbot deployment.
Step 3: Revamp Your Event Strategy
Given 65% effectiveness rating, ensure your in-person events include post-show nurture sequences and hybrid options.
Step 4: Double Down on Content Quality
Align content types with buyer preferences—case studies, video, and interactive tools.
Step 5: Align Sales and Marketing Around Revenue
Modern demand generation requires shared goals, shared attribution, and shared accountability for pipeline.
Conclusion: Data-Driven Lead Generation Wins in 2026
The numbers are clear. AI adoption is accelerating, in-person events are back in force, and content quality matters more than ever. By aligning your strategy with these 70+ B2B lead generation statistics, you can allocate budgets more wisely, improve conversion rates, and build a pipeline that withstands economic uncertainty.
Your next step: Review your current lead generation tactics against the benchmarks in this post. Identify one area where you're below average—whether AI adoption, event investment, or content personalization—and make a plan to improve it in the next quarter.
Stay ahead in B2B marketing by discovering the latest demand generation trends to grow your pipeline in 2026. For more detailed breakdowns, visit G2's lead generation statistics page.